Data Visualization
Data visualization - Animations: Astronomy
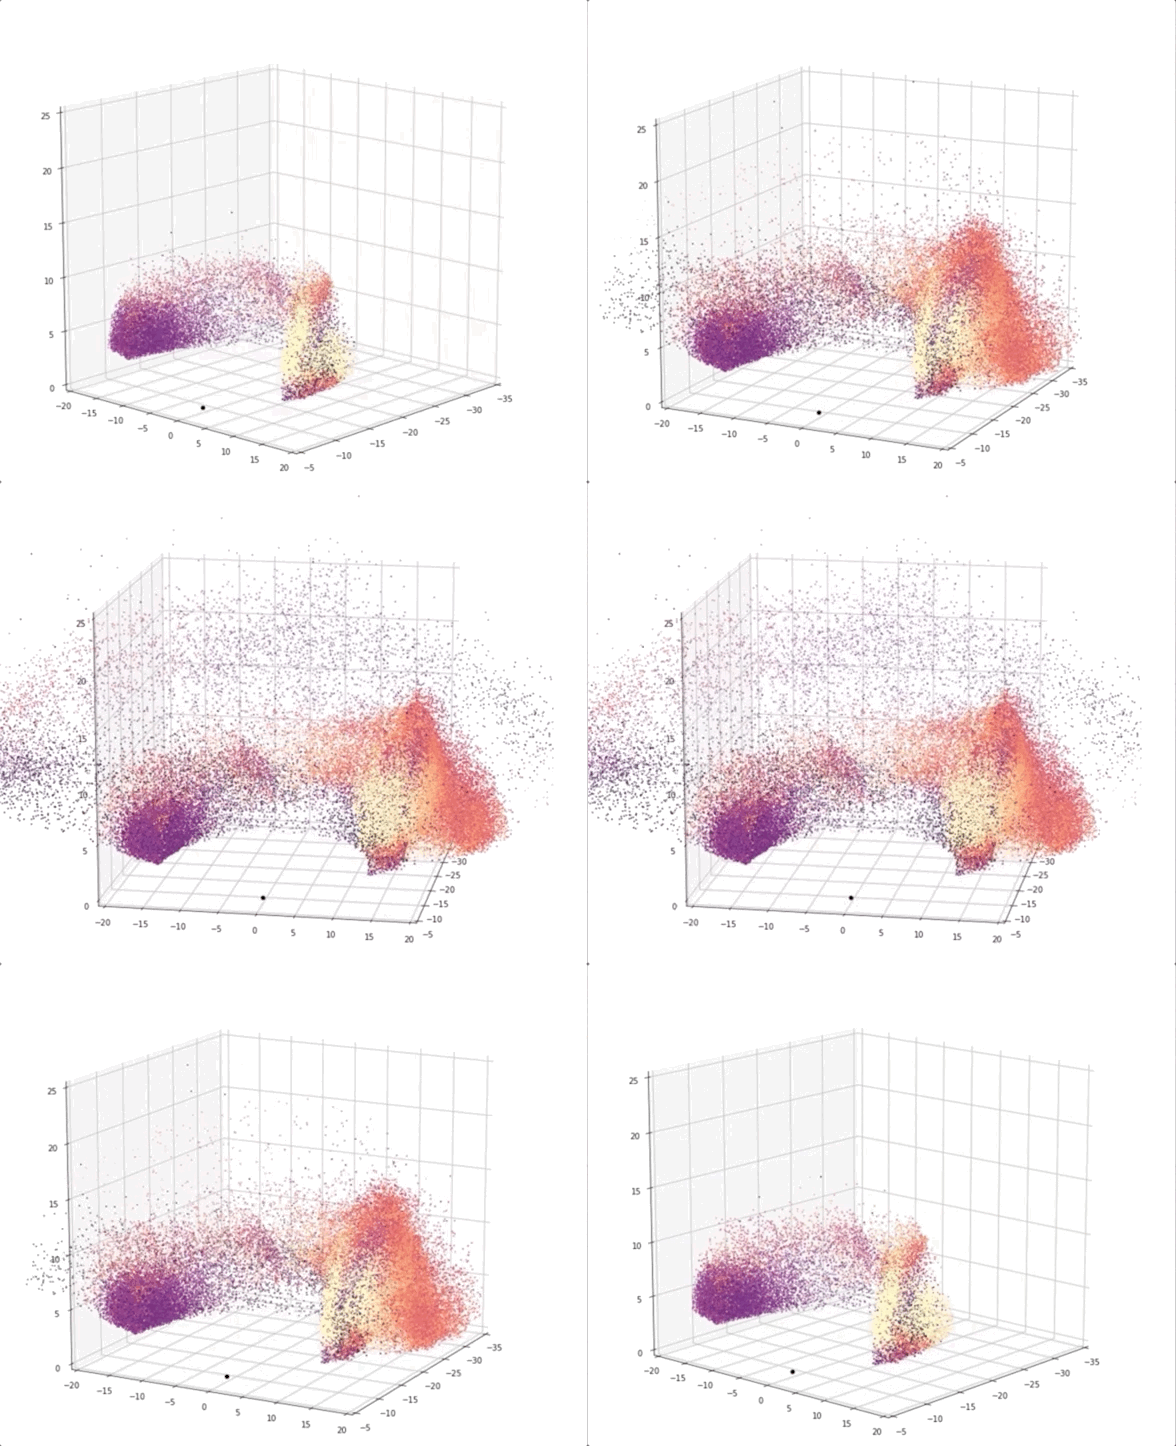
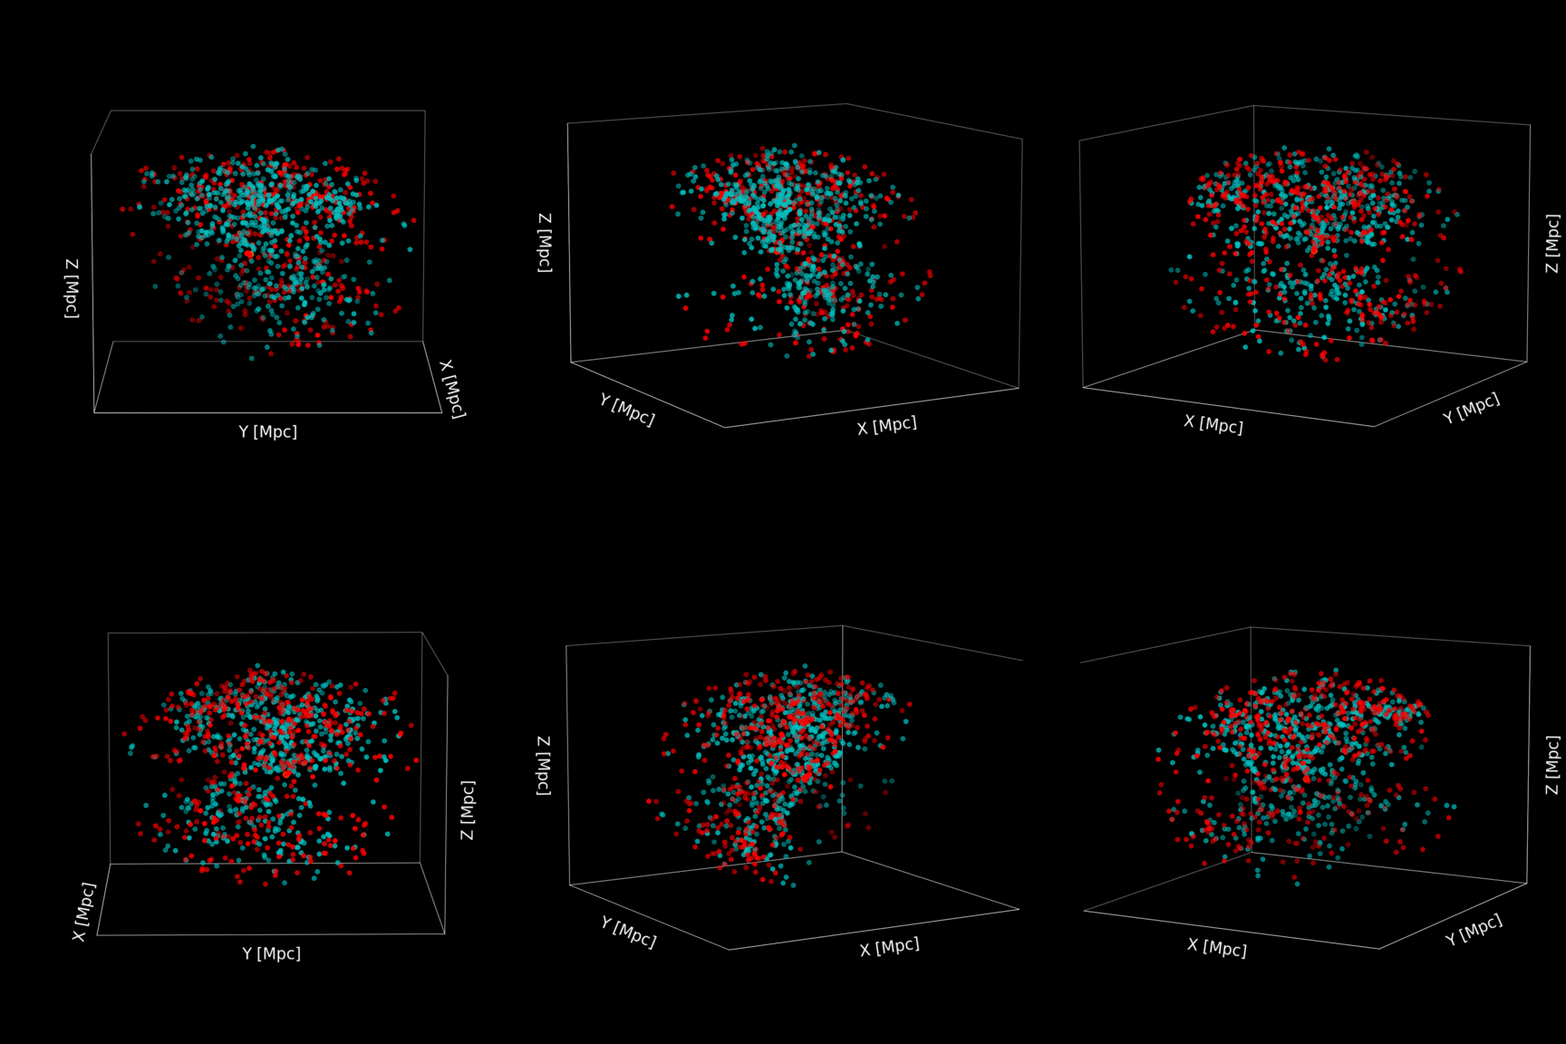
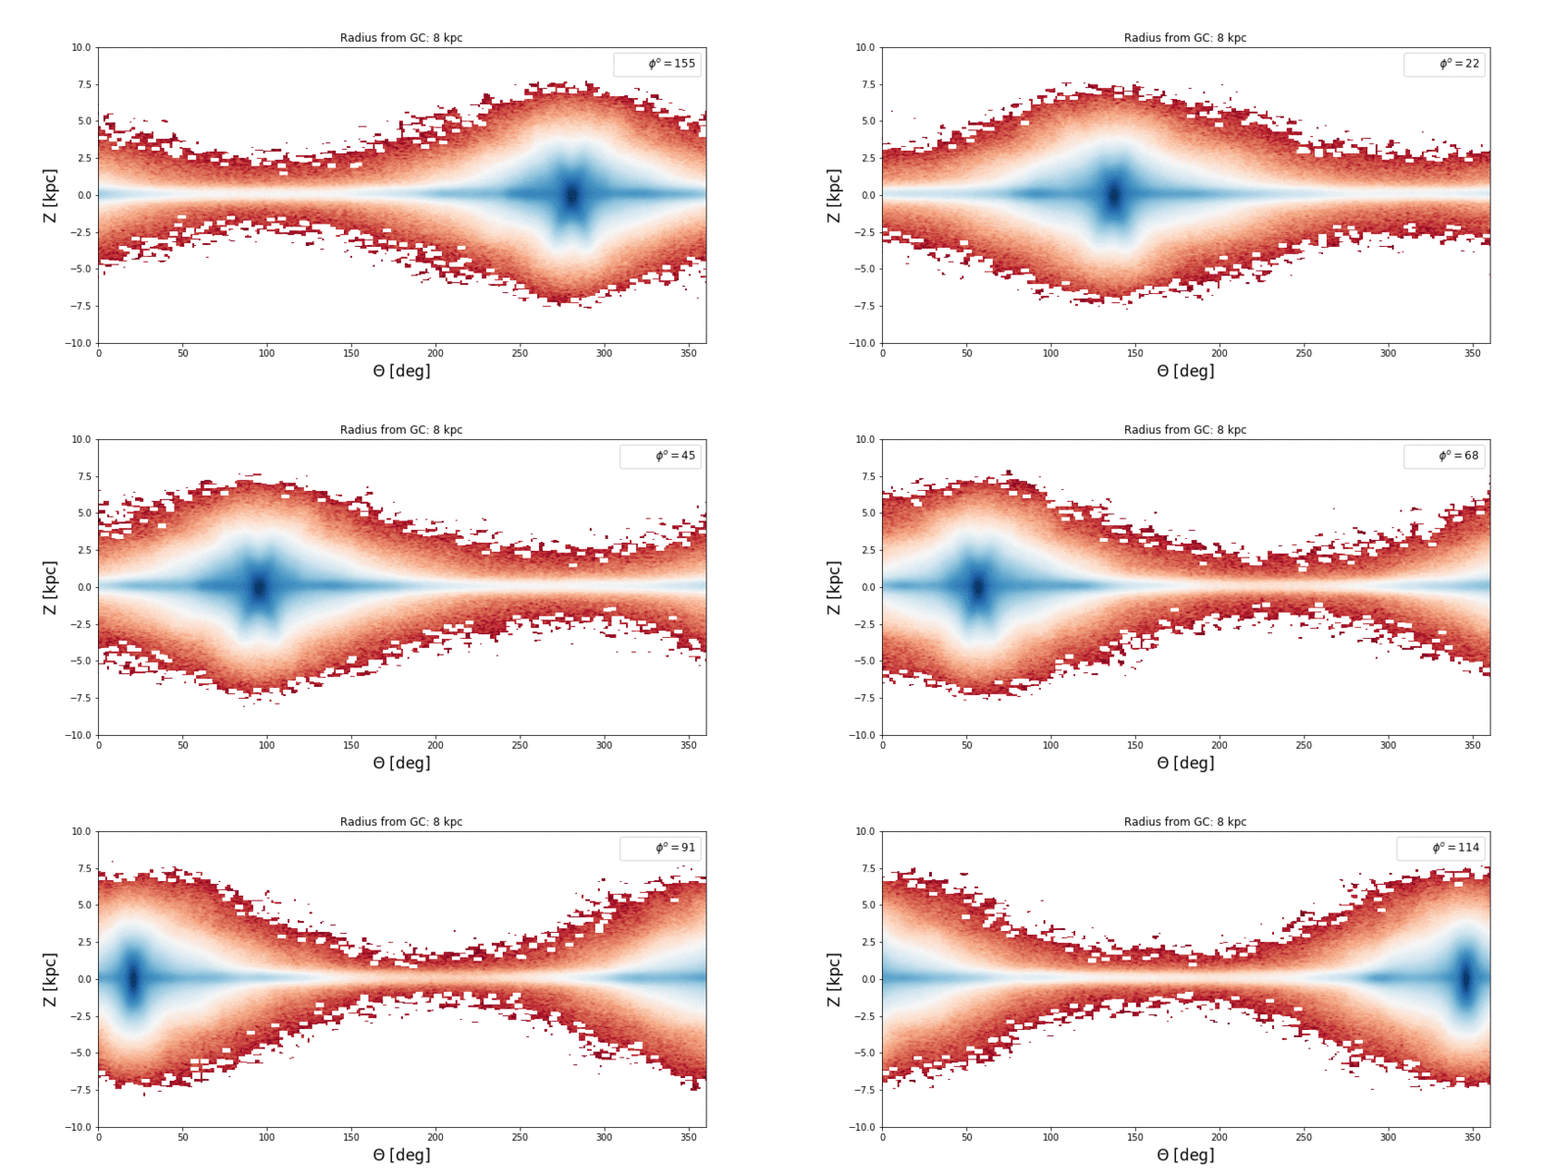
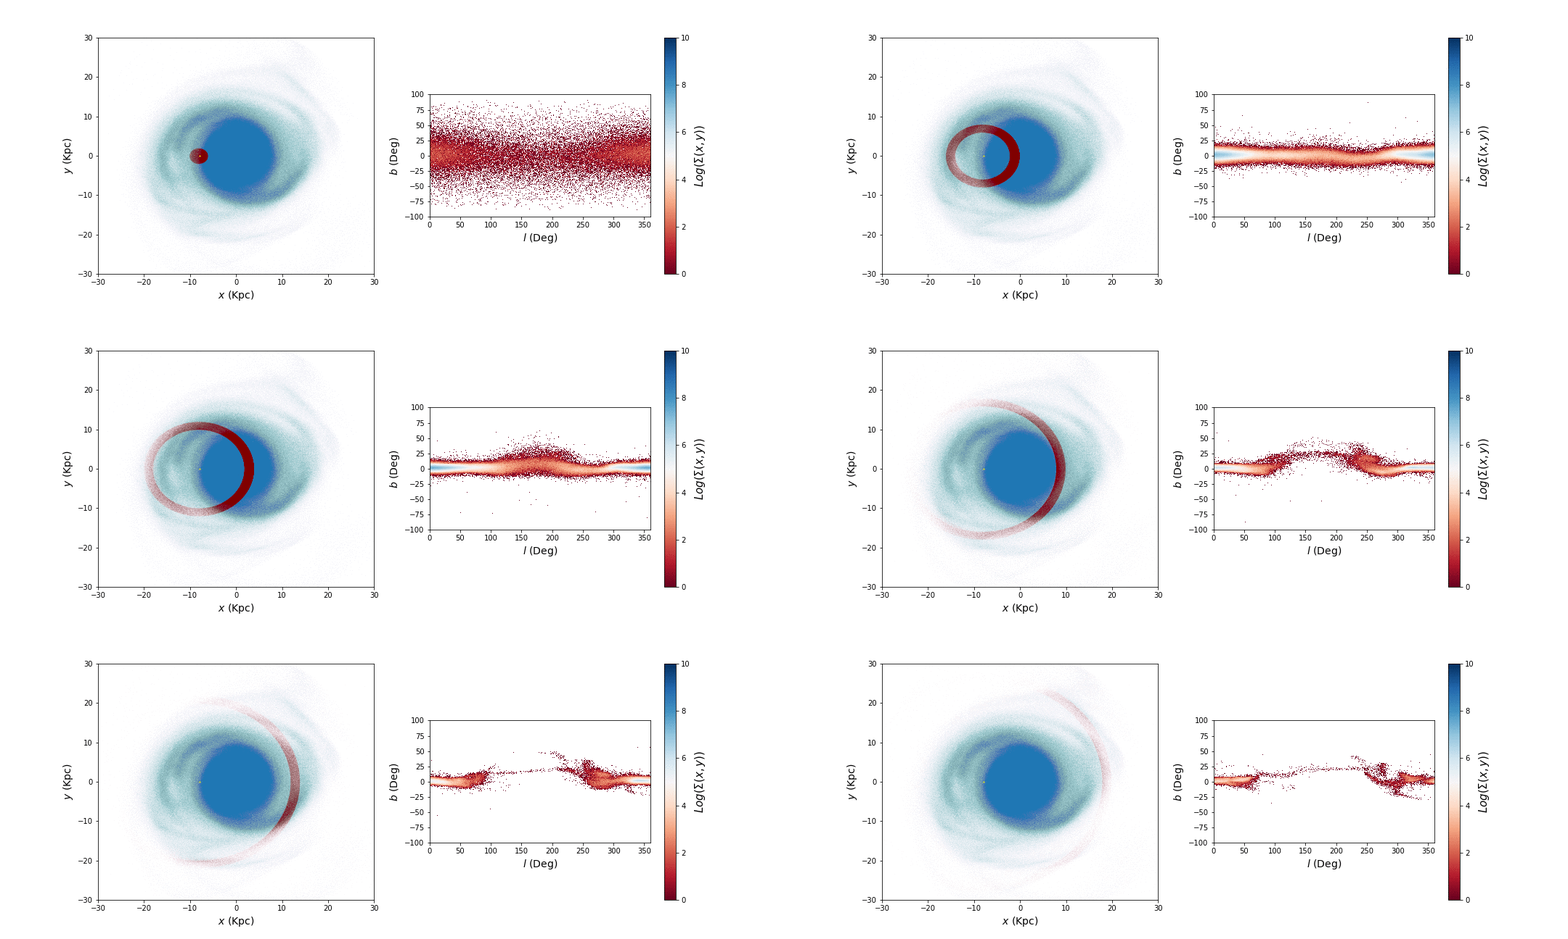
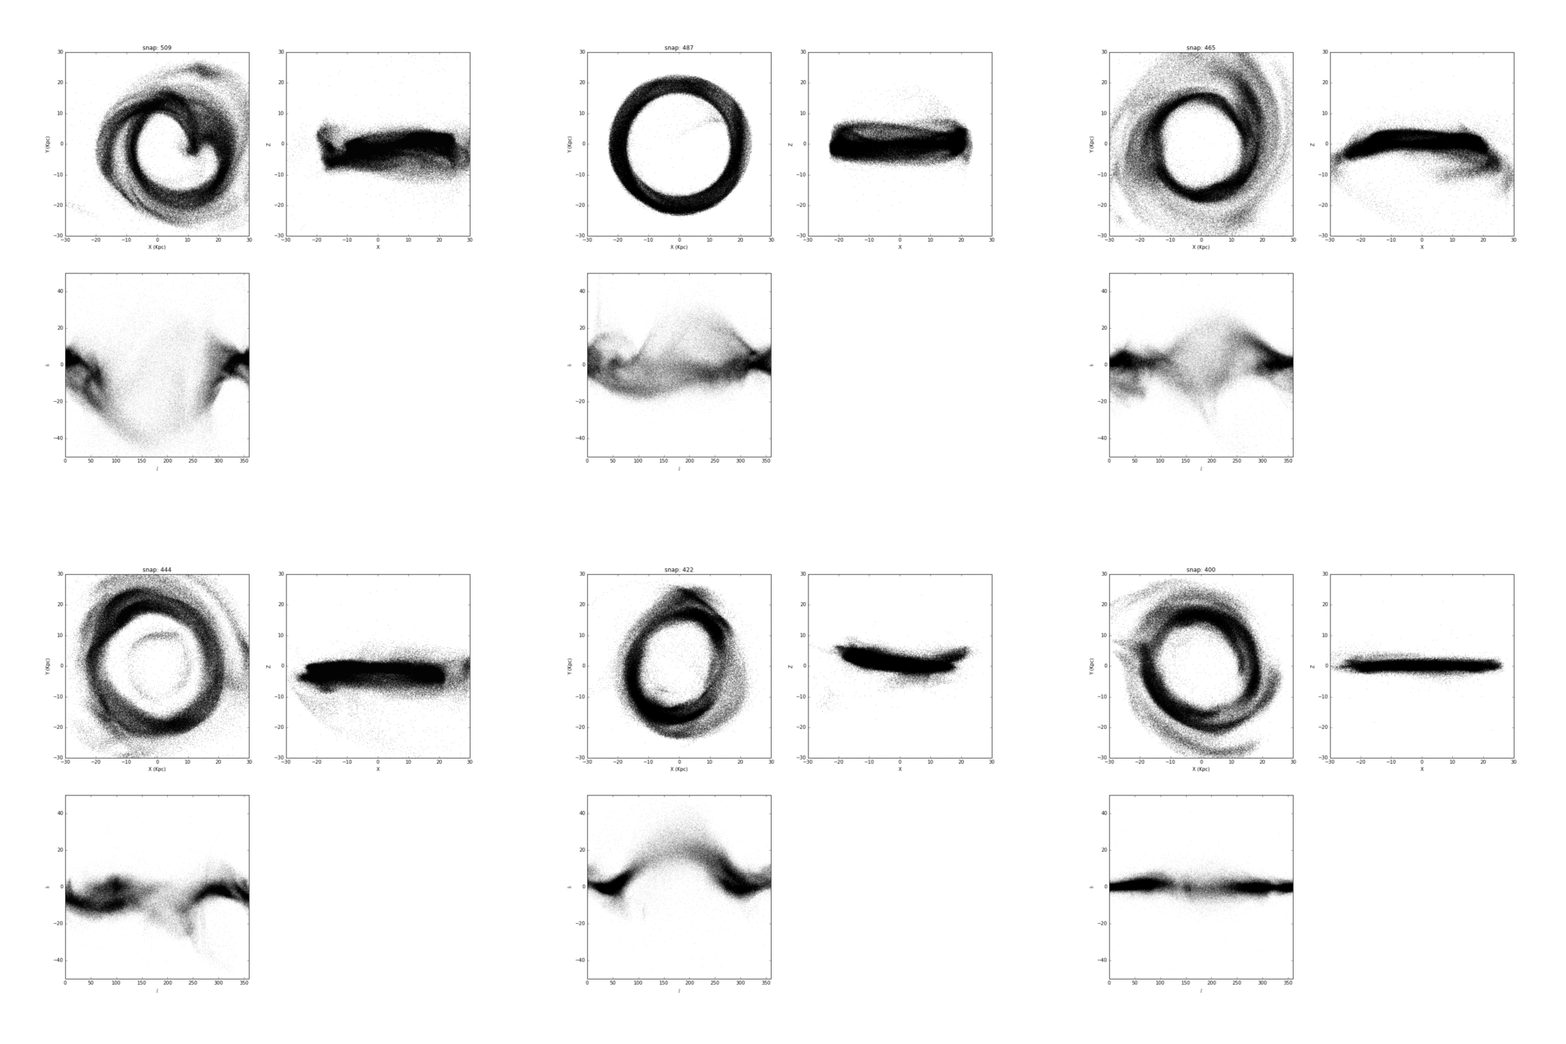
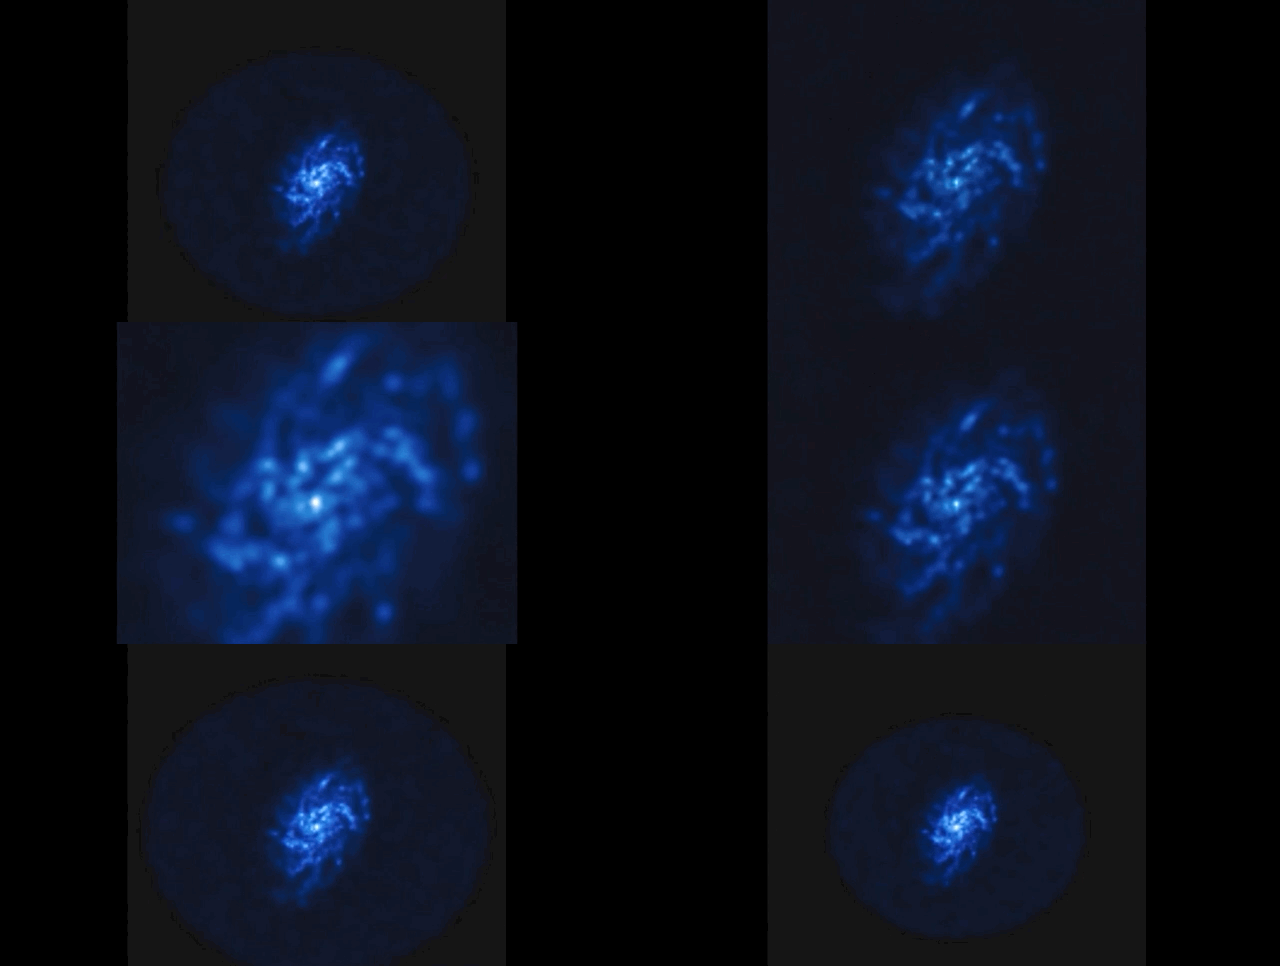
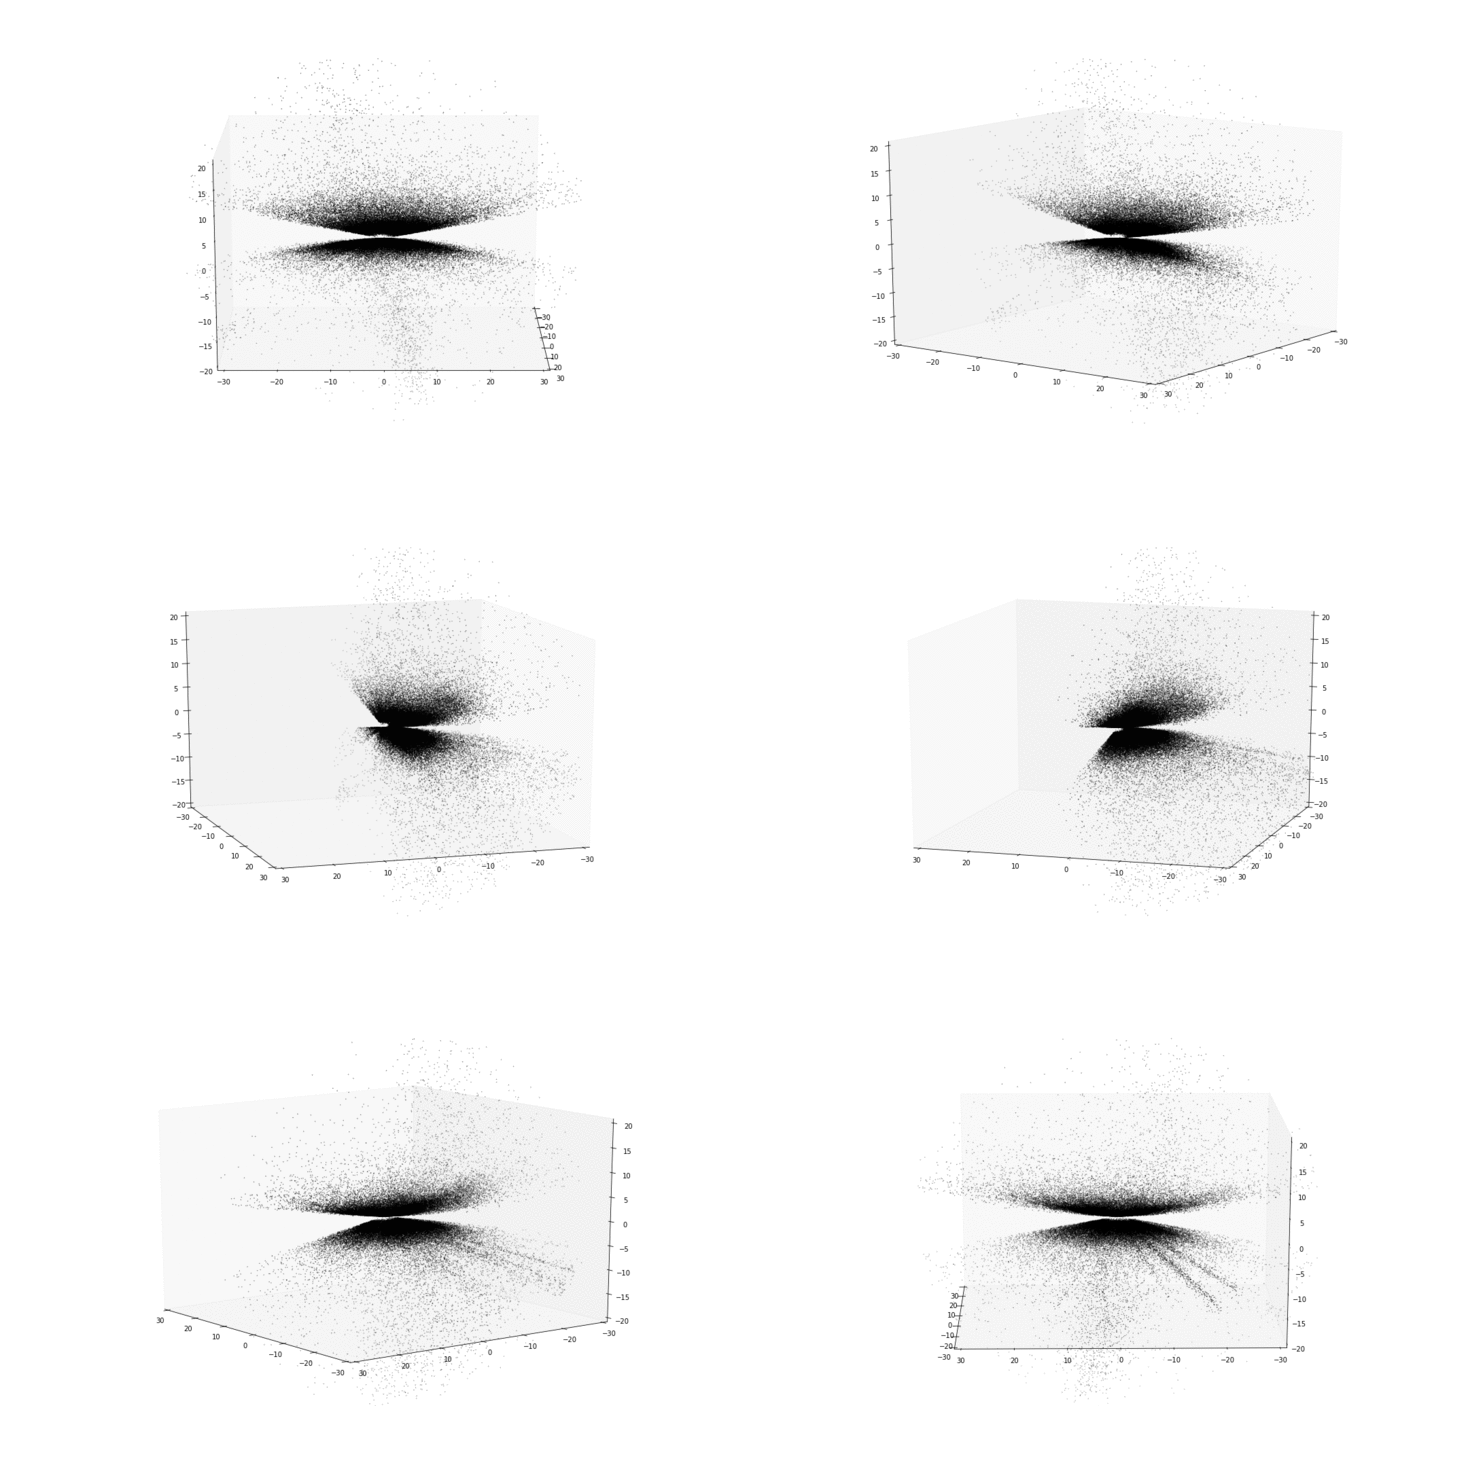
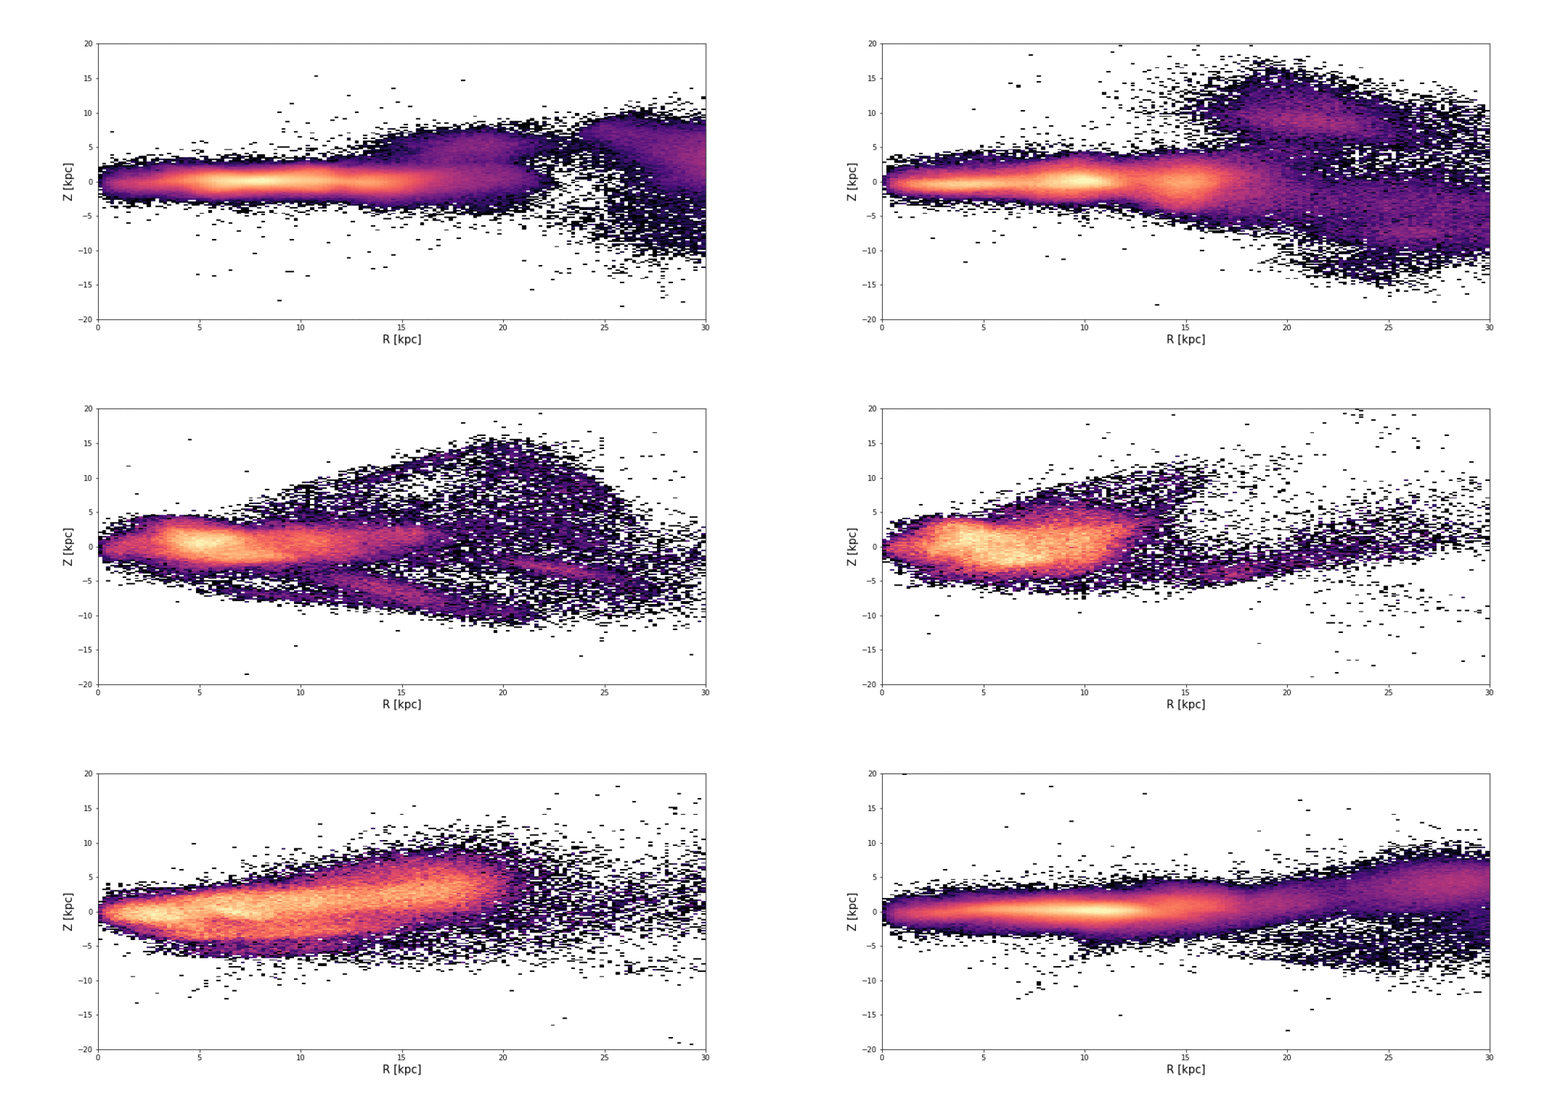
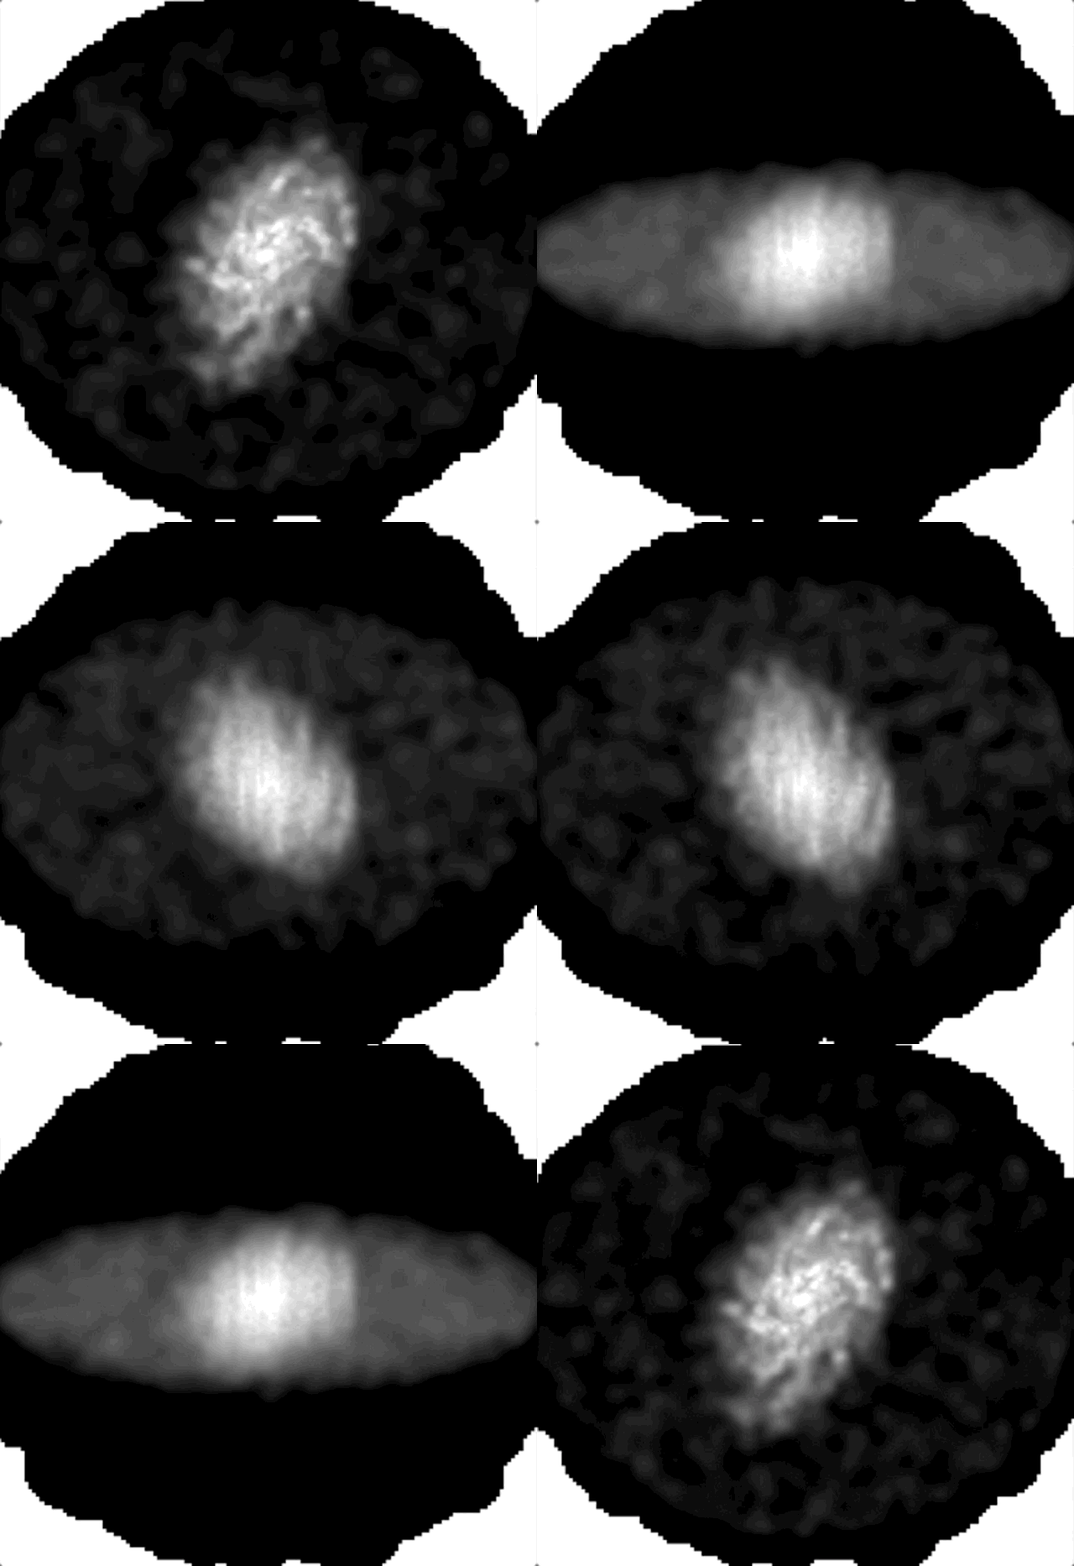
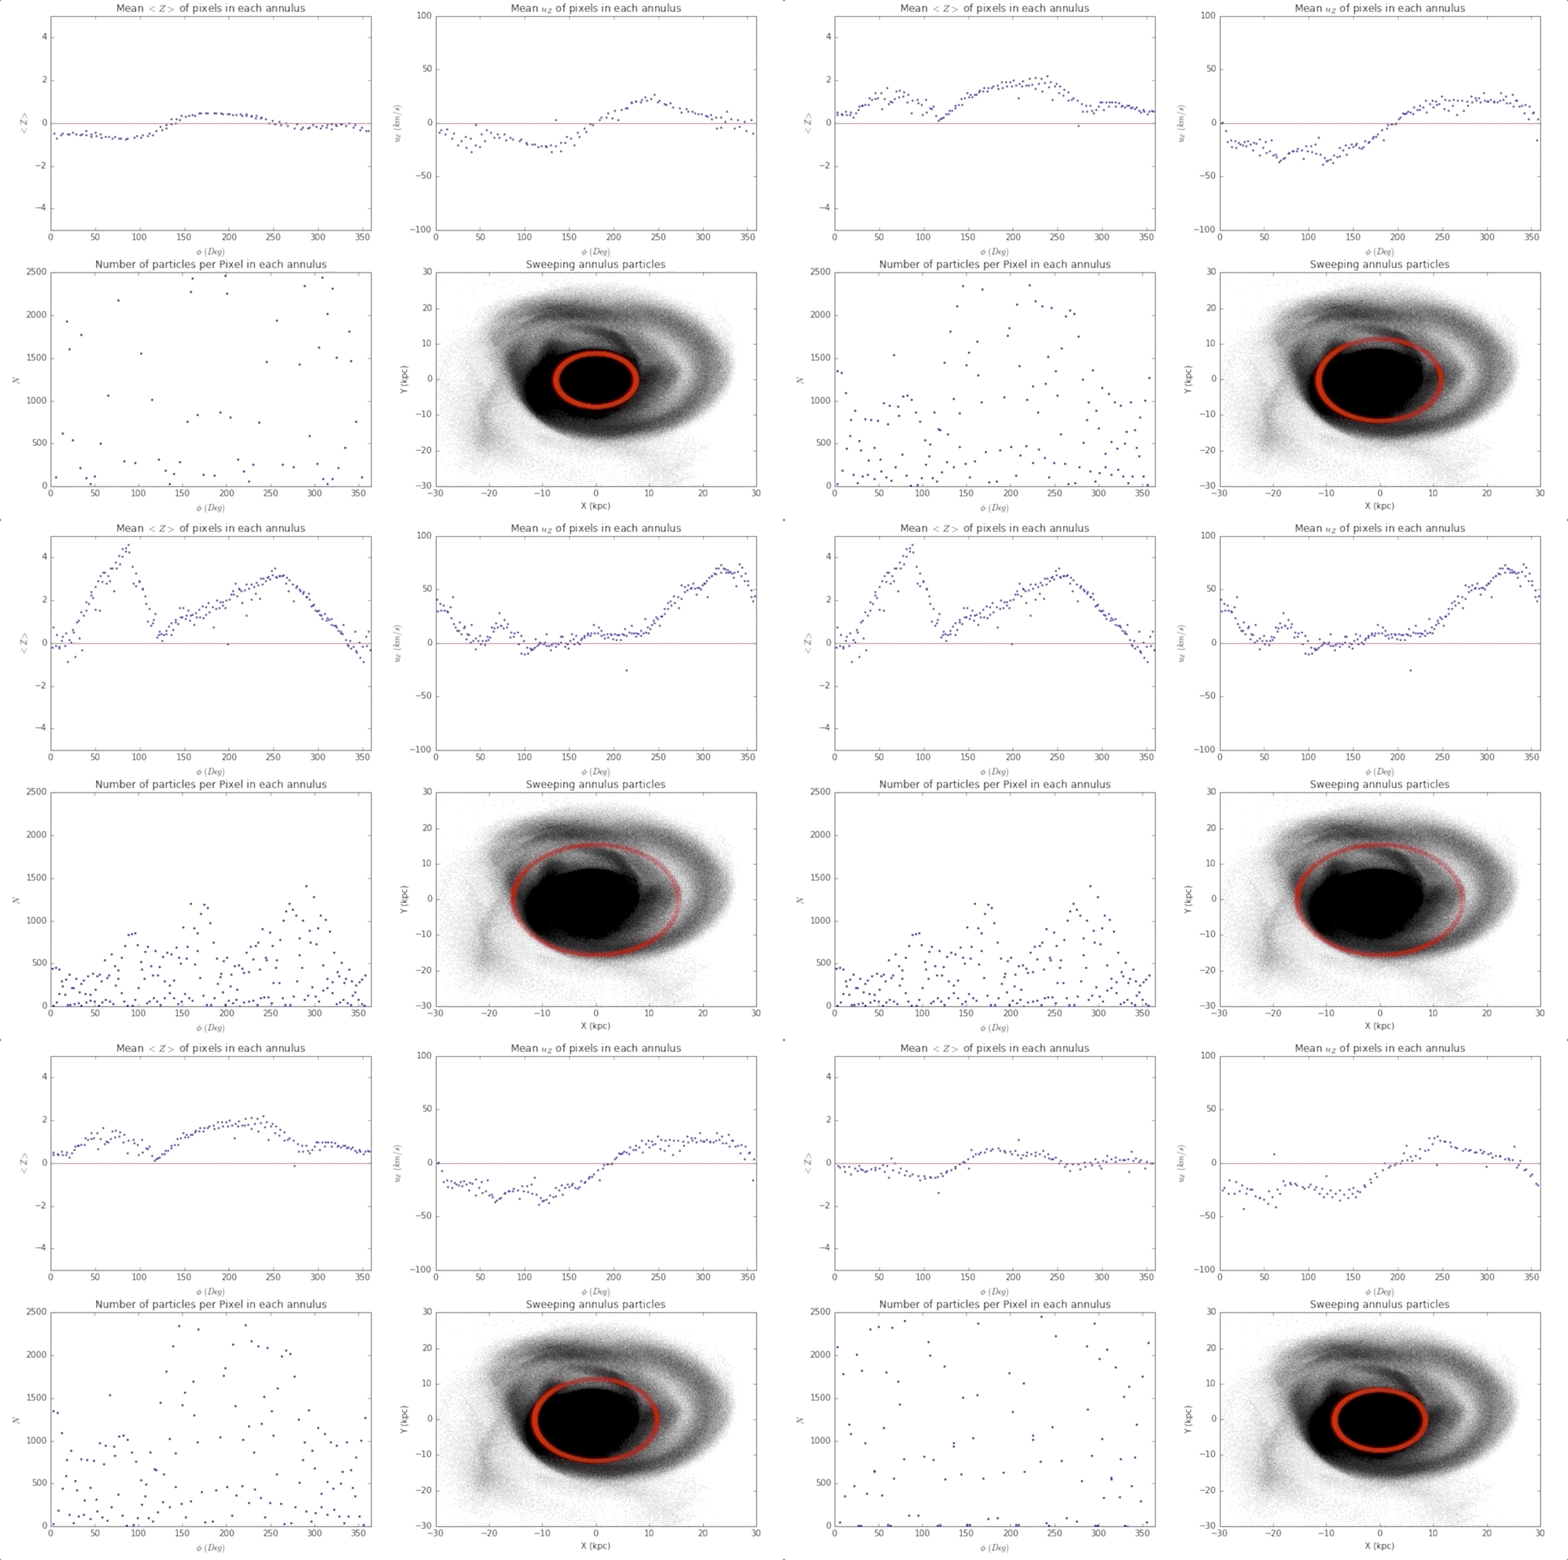
Throughout my academic research I have dedicated the last four years to making sophisticated data visualizations for the application of astrophysical discovery. My visuals aim to bridge the understanding of astrophysical data and the physical understanding of how galaxies look like in three-dimensional space.
All visuals seen here are created by Anastasios Tzanidakis. If you have questions about the data or visuals please feel free to contact me.

Data visualization - Interactive Data: Astronomy
Interactive density map of M31, using data from Gaia DR2
Interactive density map of M31, using data from Gaia EDR3
